
BALLOT — E-VOTING PLATFORM
Nigeria returned to democratic rule in 1999, marking the beginning of its longest uninterrupted democratic period since independence. Despite this, voter participation has remained a major challenge. As of the 2019 general election, Nigeria had over 84 million registered voters, yet less than half of them turned out to vote. For many citizens, voting is often seen as stressful, time-consuming, inaccessible, or lacking transparency.
These challenges contribute to low participation and low trust in the electoral process and reveal a broader civic and product problem: how might we make voting more accessible, transparent, and easier for citizens to participate in?
Ballot is a concept digital voting platform designed to explore how technology could improve accessibility and participation in the Nigerian electoral process. The idea was to explore a future where eligible citizens could verify their identity using their voter’s card, cast their vote through a guided digital experience, and follow election results from a single platform. This project is not intended as a replacement for Nigeria’s existing electoral system, but rather as a product exploration into how the experience of voting and civic participation could be redesigned to be more accessible, clearer, and more user-friendly.
The goal of this project was to explore how a digital-first voting experience could reduce friction in the voting process, make participation more accessible to more citizens, and improve trust and transparency in how elections and results are experienced. Rather than focusing on technical implementation or policy, the project focused on the user experience challenges that prevent people from participating in the first place.
I led the overall design direction of the project from problem definition through execution. My work included user research, shaping the product direction, designing the user flows and information architecture, creating low and high-fidelity designs, and prototyping and testing the experience. I also worked closely with the rest of the team to define requirements, review solutions, and iterate based on feedback.
Figma, Miro, Adobe Photoshop, Illustrator, Google form.
The project lasted 6 months
The project was a collaboration between two UX designers, and two engineers, working together to explore the problem space, shape the solution, and validate the ideas.
Ballot's responsive landing page design
At this phase, we had limited information about the problem we were trying to solve. Everything we had imagine exists, but it is only an assumption. We needed to validate these assumptions, so we conducted a qualitative interview to gain a deep understanding of our users' frustrations, motivations and to better understand the actual problem.
I interviewed eligible voters of Nigeria to understand how they go about with the current voting process. The research focuses on understanding their behaviors, needs, and motivations through structured observation.
People don't go out on election day to cast votes because they feel a surge of election violence during the process.
On some occasions, there are delays in opening polling units and malfunctioning systems that interrupt voting.
Most people do not exercise their civil right to vote because they feel their vote does not count.
Pre-election violence tends to be more localized, it involves conflict between supporters of competing political parties.
Some individuals do not even have a voter's card because the voter registration process is too tedious, frustrating, and time-consuming.
Some people find it difficult to travel back to their registered polling unit before and during the election to cast their votes.
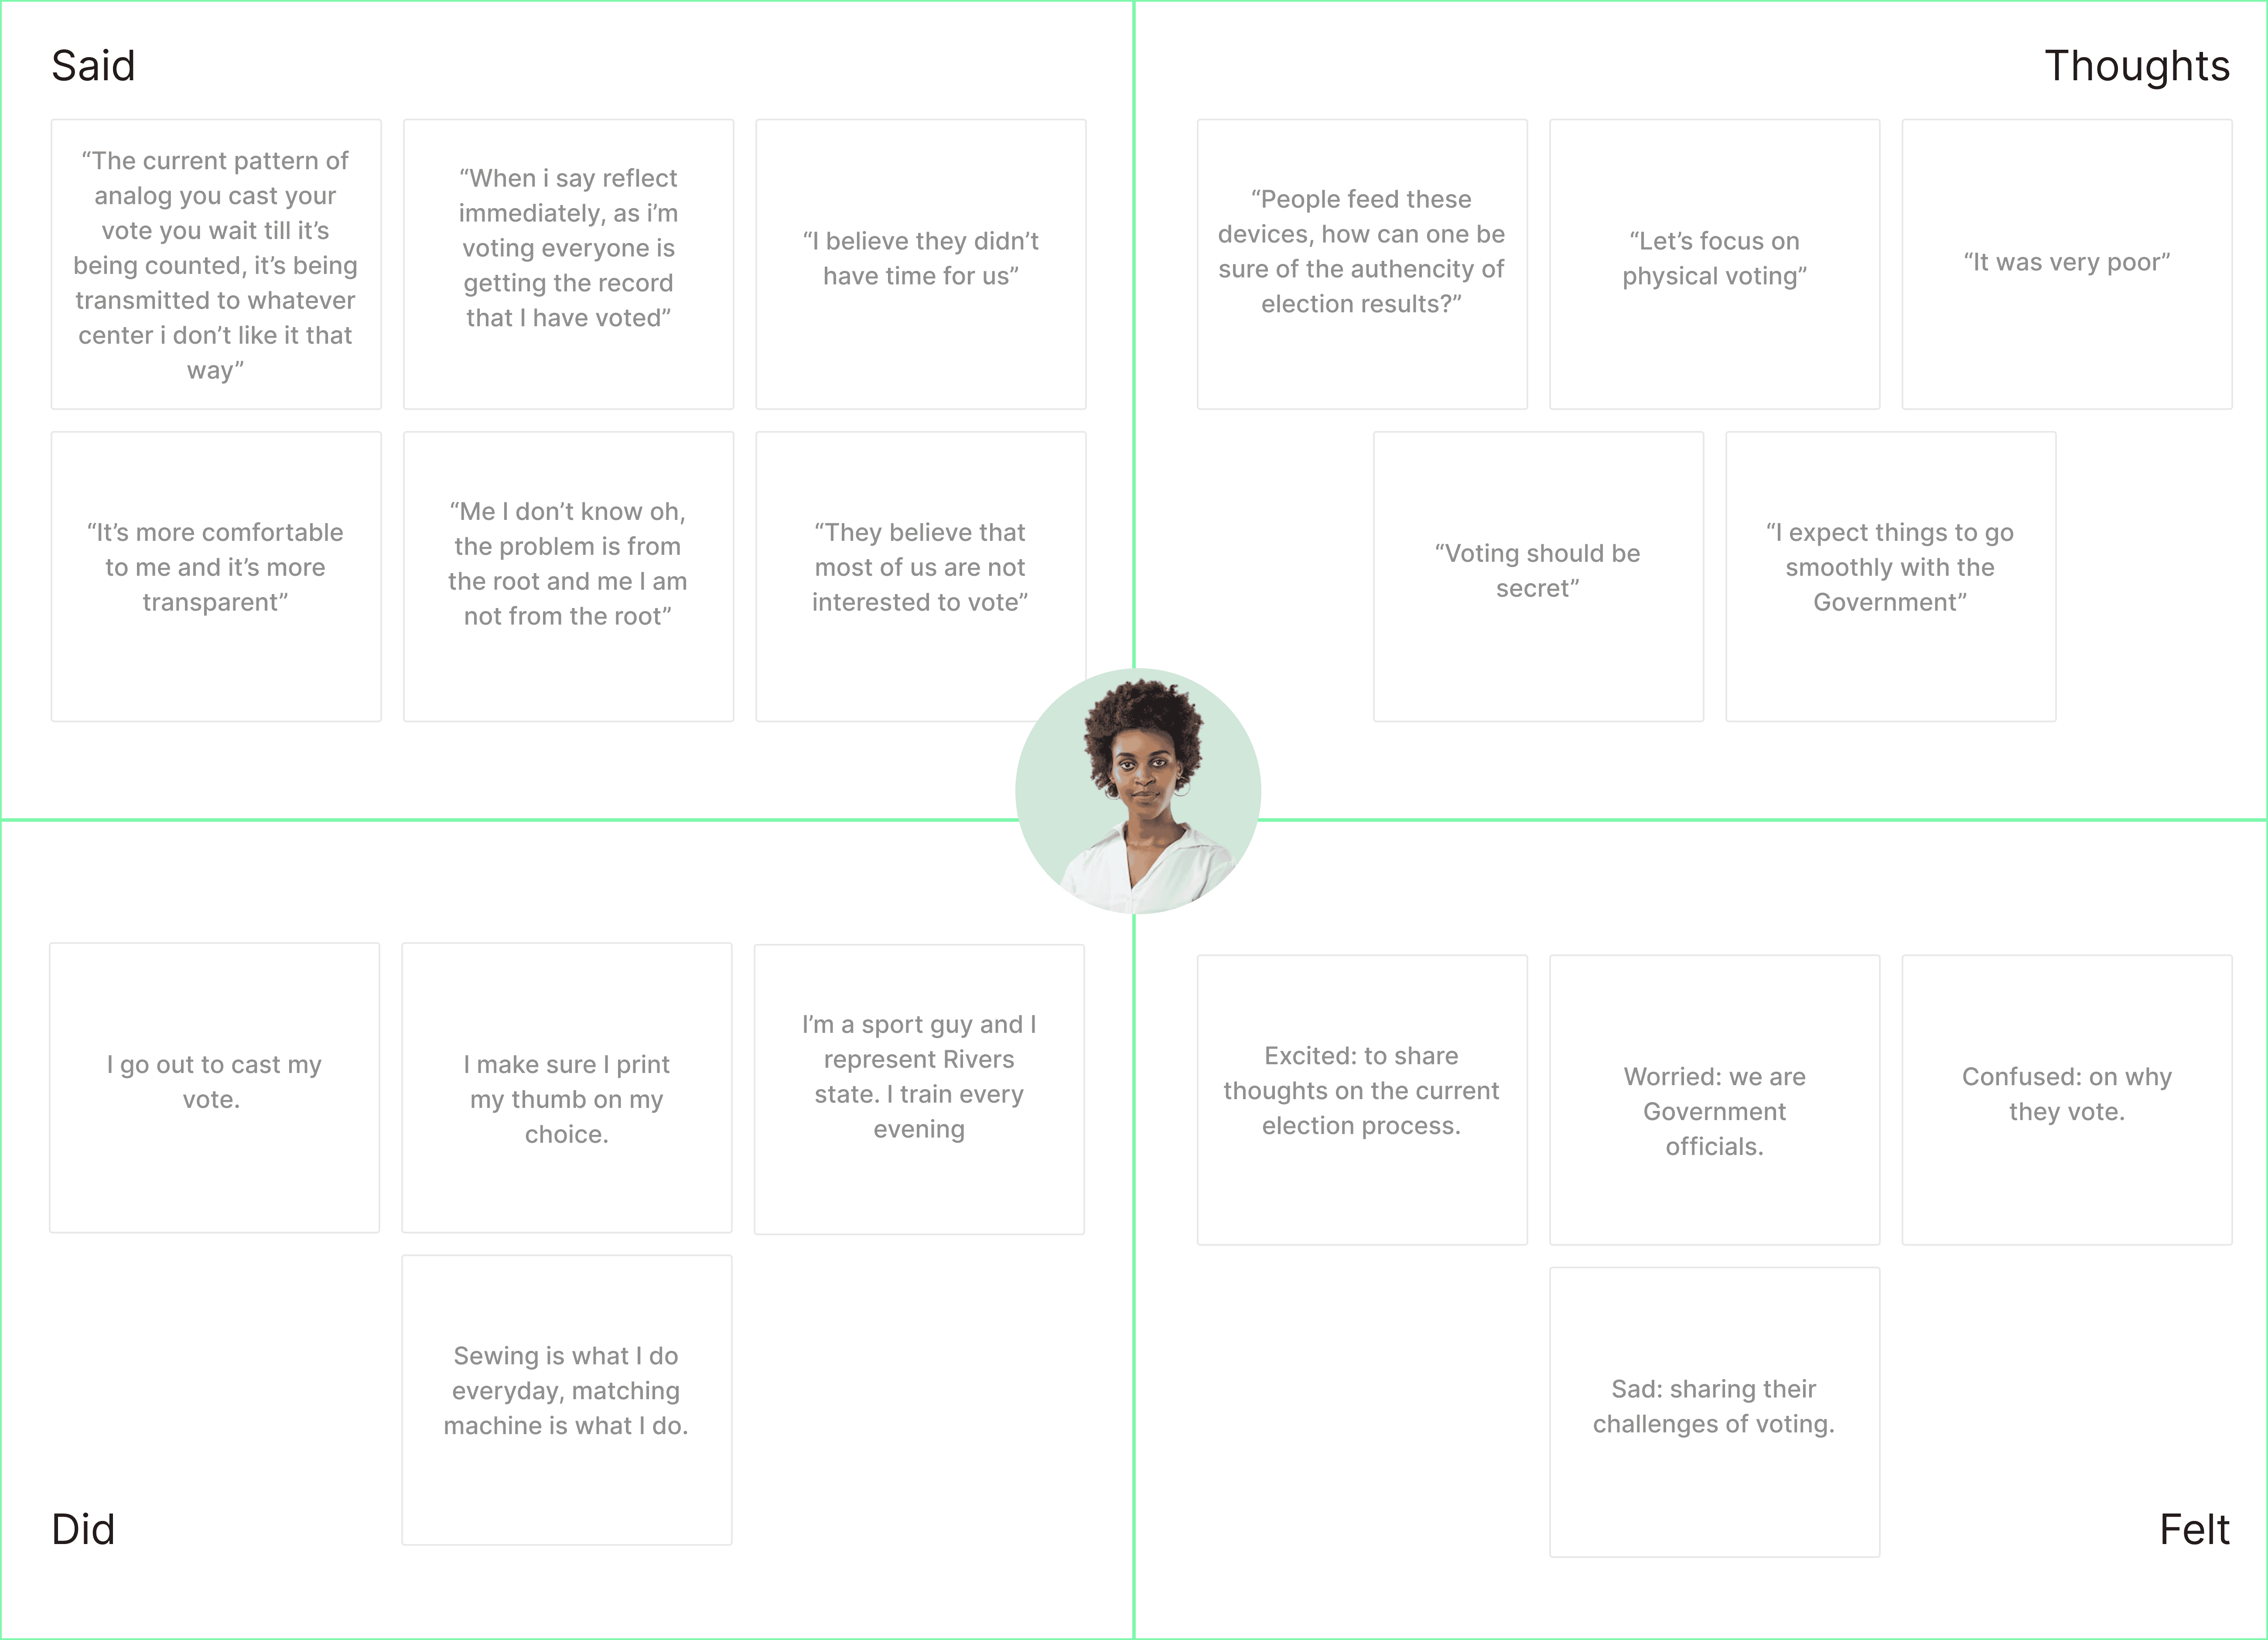
Considering the variation of our users, I interviewed 3 category of people that were a reflection of our target audience, 3 each of adults, young adults, and people living with disability who can or may have exercised their civil right to vote through structured observation. The interview questions were developed to gain a deep understanding of users' challenges and motivations.
After collecting feedback from people, I added each observation from our Interview to a sticky note. Next, I organized the sticky notes together into themes and patterns. And finally, we gave each of those themes a name to represent what that theme means.
We work through each theme to pull out findings that can potentially be turned into insights. We started with those we consider to be a high priority on our research objectives.
Due to insecurity, ballot boxes are easily hijacked by thugs during the election.
Some people believe election results are easily manipulated during the counting procedure.
Elections are usually postponed due to violence, delays in opening poll centers, and malfunctioning card readers.
Most people do not cast their votes during the election because of the uncertainty of the result and accompanying violence.
Most people do not go out on election day to vote because they feel the candidate occupying the seat will eventually emerge as the winner.
Delay in the arrival of electoral materials results in a late start of the election.
Some people do not know the importance of exercising their civil rights.
As we synthesized each theme and its subsequent findings, we came up with some insights.
Some people sell their vote due to hardship for immediate satisfaction, not minding the long-term effect of their decision.
Some people do not know the reasons why they should vote. They vote because money and promises are the rewards for exercising their civil right.
Some people do not care about the consequences of when the wrong candidate emerges as the winner but rather focus on the money to be given to them, thereby storming polling units, destroying electoral materials, and chasing away voters and officials of the Independent National Electoral Commission.
Most geopolitical zones have designated party during the election that influences the choice of the people living there. People are forced with all measures (like bribery and violence) to abide by the zonal choice.
Key Insights
The current voting process does not accommodate physically challenged citizens.
The process has structured a belief among people that physically challenged citizens are expected not to participate in the election or exercise their civil rights.
The key insight we uncovered through user research and subsequent analysis, "The current voting process does not accommodate physically challenged citizens. The process has structured a belief among people that physically challenged citizens are expected not to participate in the election or exercise their civil rights," guided our next step in the design process. We needed to focus on learning about this underrepresented group, so we conducted a qualitative interview to gain more understanding of their frustrations, behaviors, needs, and motivations.
After collecting the second round of feedback from people, we followed our initial steps of adding each observation from our interview to a sticky note. Next, we organized the sticky notes together into themes and patterns. And finally, we gave each of those themes a name to represent what that theme means.
As we have done earlier, we work through each theme to gather findings from the synthesized feedback from the focus group.
Elections in Nigeria, if not always, accompanied by violence, physically challenged citizens are more vulnerable to harm.
Most physically challenged citizens would prefer a house-to-house voting system.
Delay in the arrival of electoral materials results in a late start of the election, which poses more stress to physically challenged citizens during the election.
The current voting system is not inclusive of physically challenged citizens.
The physically challenged citizens feel less represented by the Government due to their constant complaints about creating a space for them.
Some physically challenged citizens prefer the current voting process because they get to go out and see other people casting their votes.
Key Insights
Society thinks physically challenged people are uneducated and have no meaning in living. It causes them to lose interest in the political affairs of the country.
Election-related violence, tedious voters' registration process, and social discrimination have caused a low turn up of physically challenged citizens to exercise their civil rights.
I needed to establish a common ground among my team members for us to have a single, shared understanding of the user, and to better understand and prioritize user needs. What drives users' behaviors? was an important question to understand in order to uncover user needs. By visually articulating what we know about our users through research helped in decision making.
The target user persona was defined properly from the user research, affinity and empathy mapping. The personas helped promote empathy, memorability of target users, prioritize features, and inform design decisions.
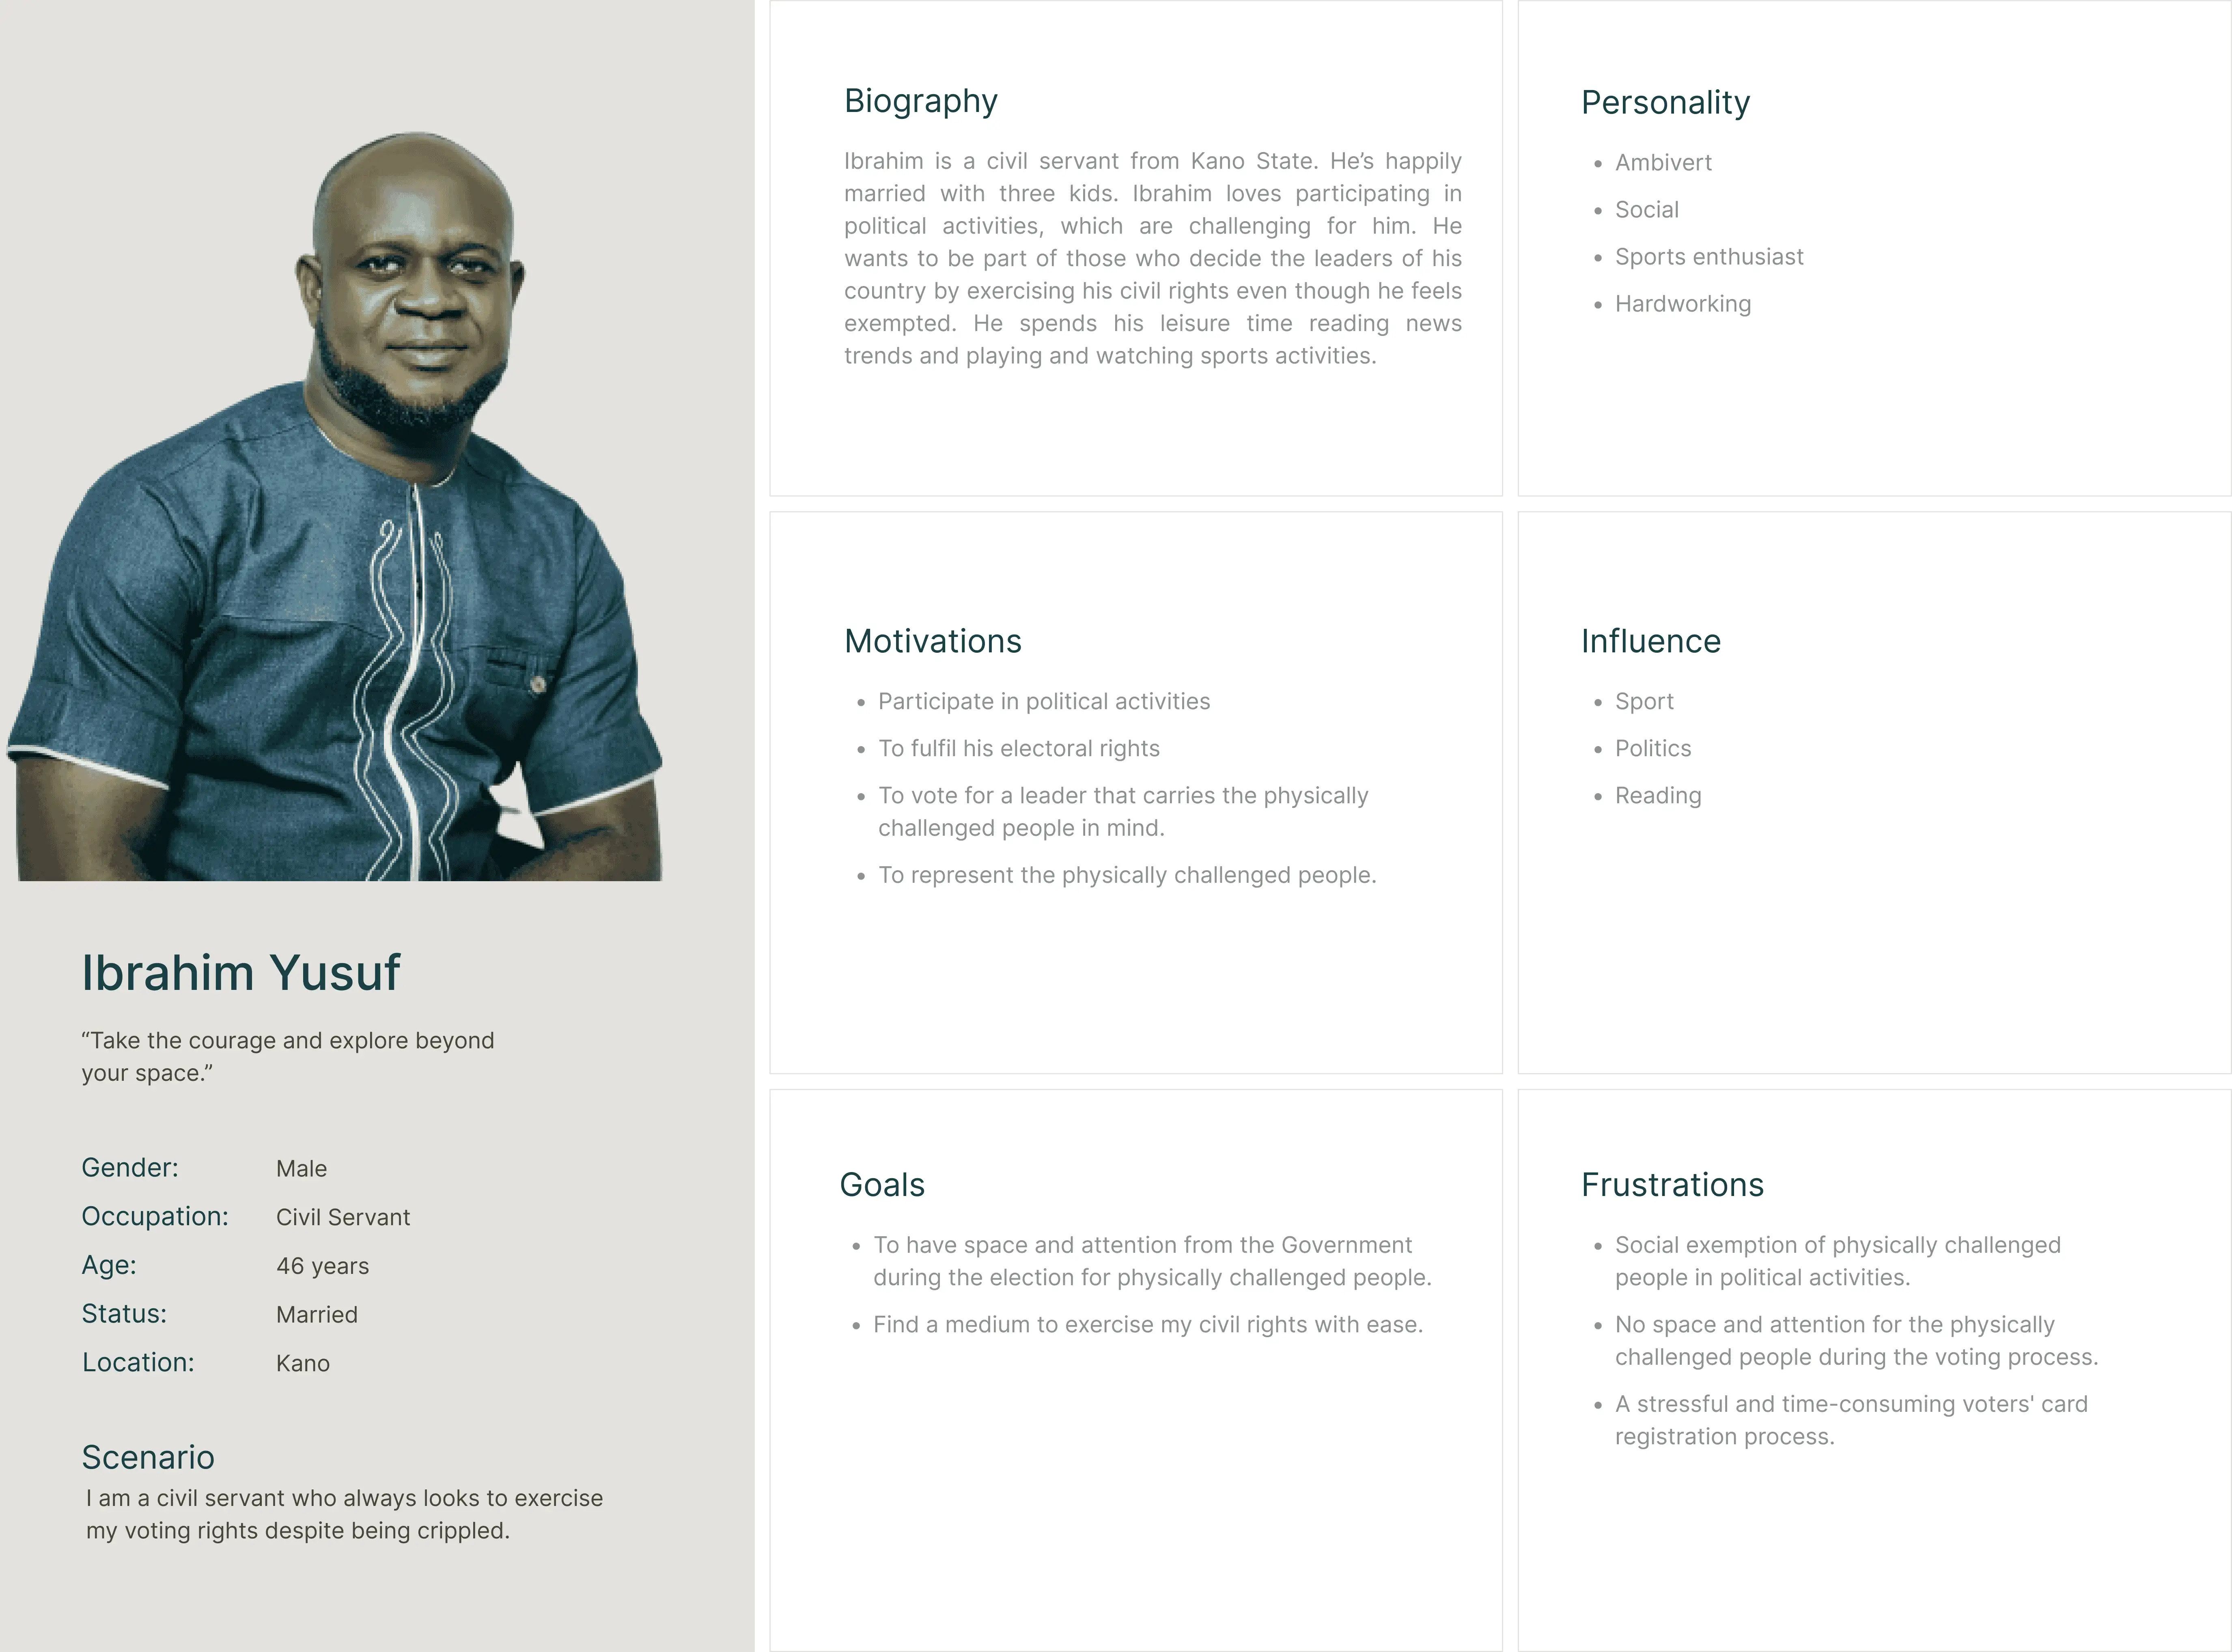
User persona one
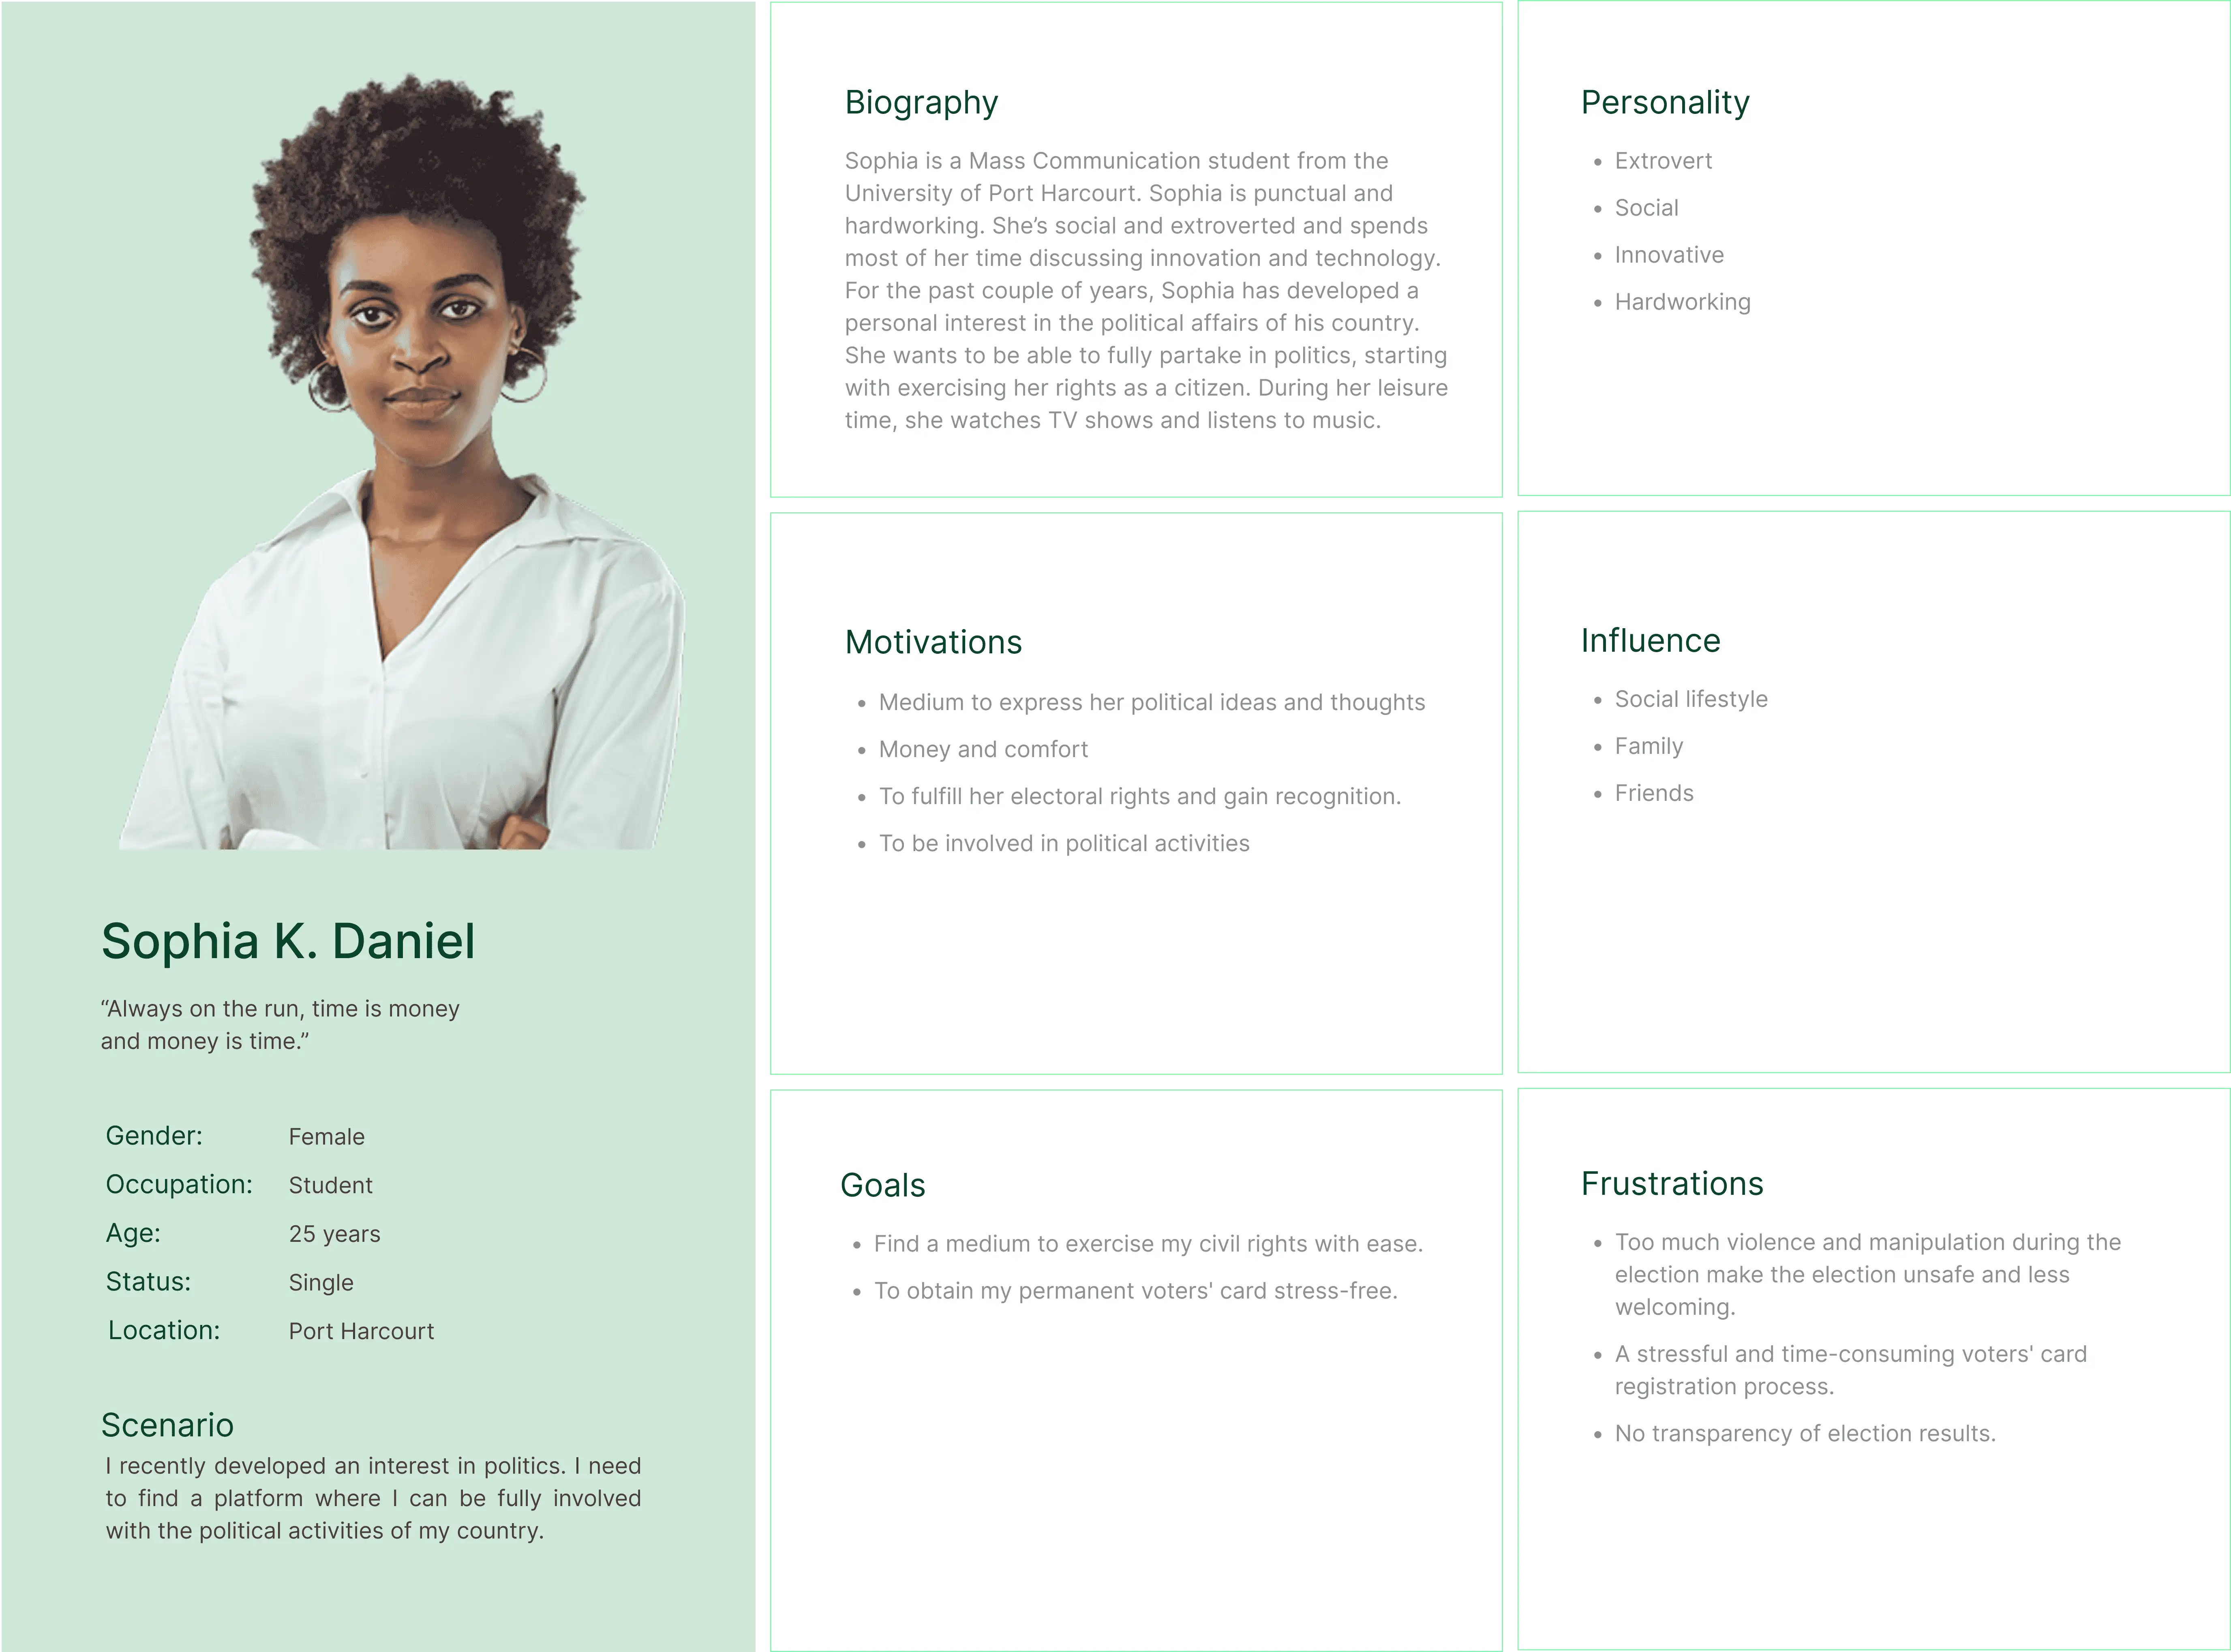
User persona two
As a team, we collaboratively created user journey maps for citizens eligible to vote and the underrepresented group in order to further understand their goals, frustrations, and motivations by visualizing the process it takes them to cast a vote.
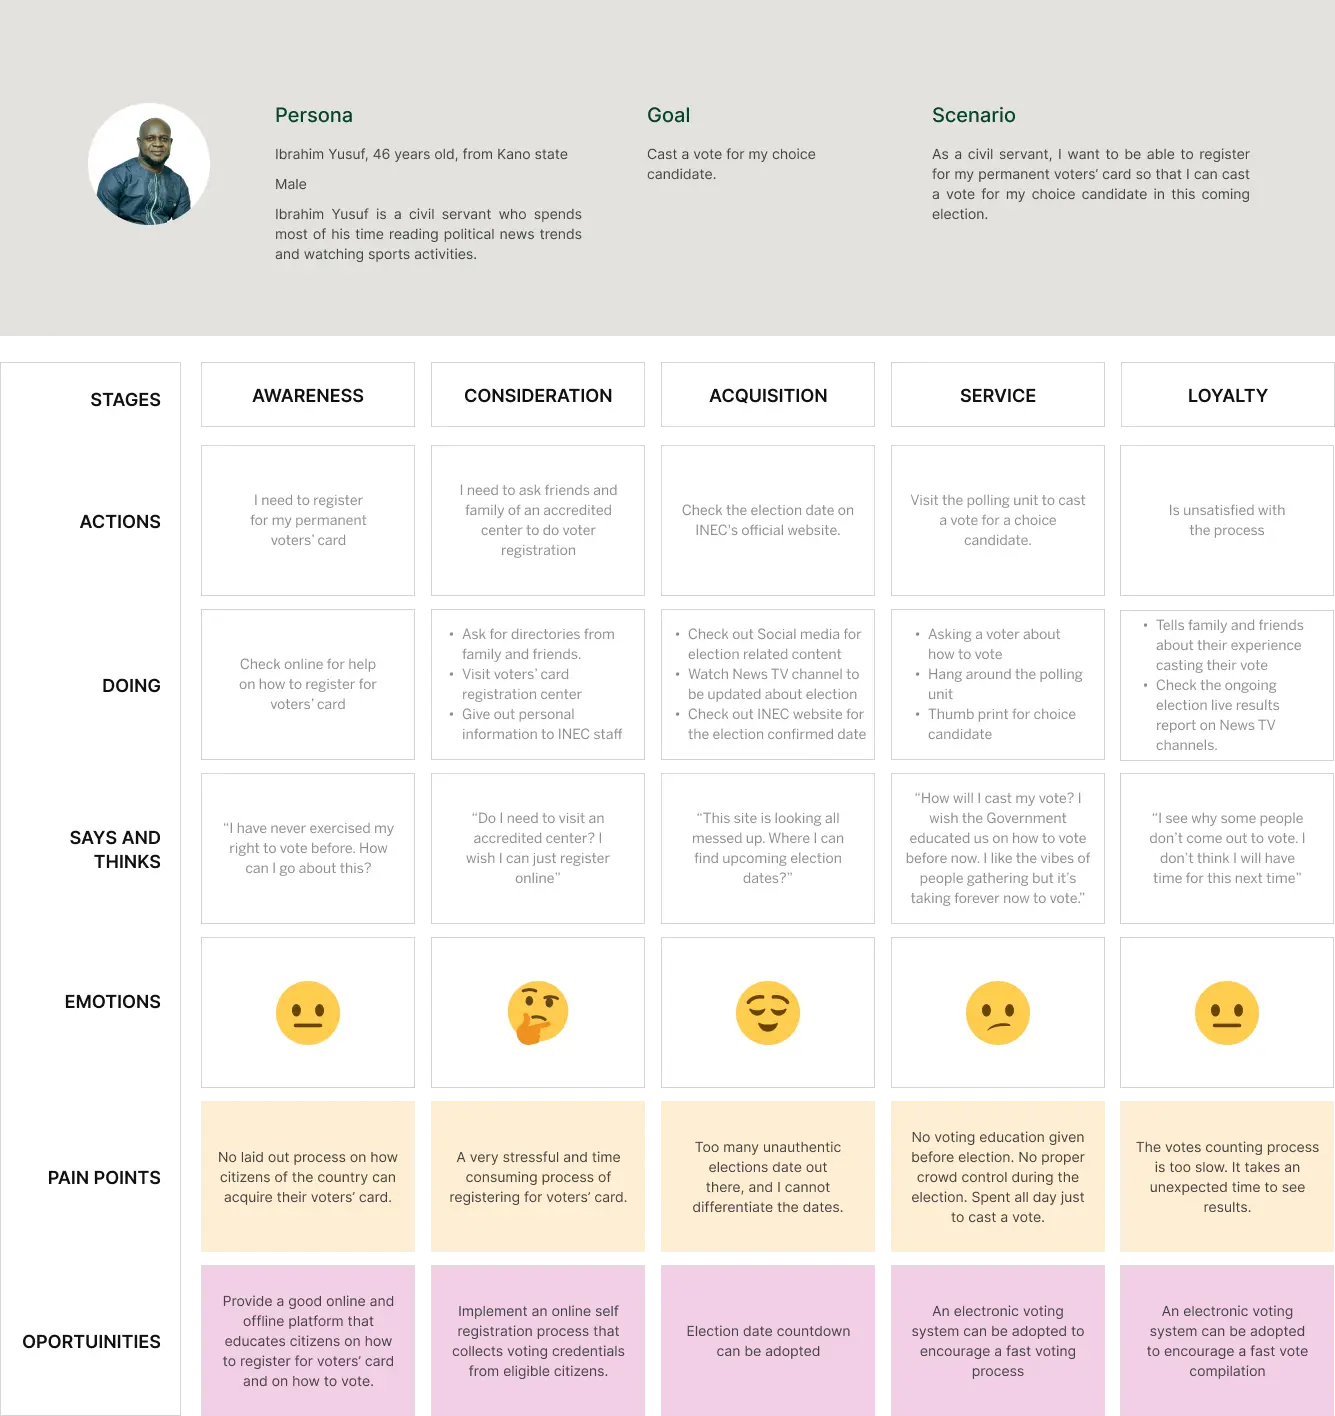
An example of one of the two user journey maps we created
After a proper user definition, highlighting their needs, and the insights we have come to know through our research, we came up with some actionable problem statements.
At this point, we started using our point-of-view problem statements by asking specific questions with "How Might We" to generate ideas for the coming phase.
With no attempt to judge, we generated a broad set of ideas using different ideation techniques. We were more focus on quantity rather than quality.
To remove creative blocks and make the ideation session a judgment-free zone, we started by coming up with the worst possible ideas on how we can solve the problems faced by our users.
We timed ourselves and came up with ideas that focused on the point-of-view problem statements. We stayed on the topic, deferred criticism, and aimed for quantity. We encouraged weird and wild ideas and built on each other’s ideas.
Using the Post-It-Voting Ideation method to select ideas, we collected the best solutions by categorizing, refining, and narrowing down the ideas.
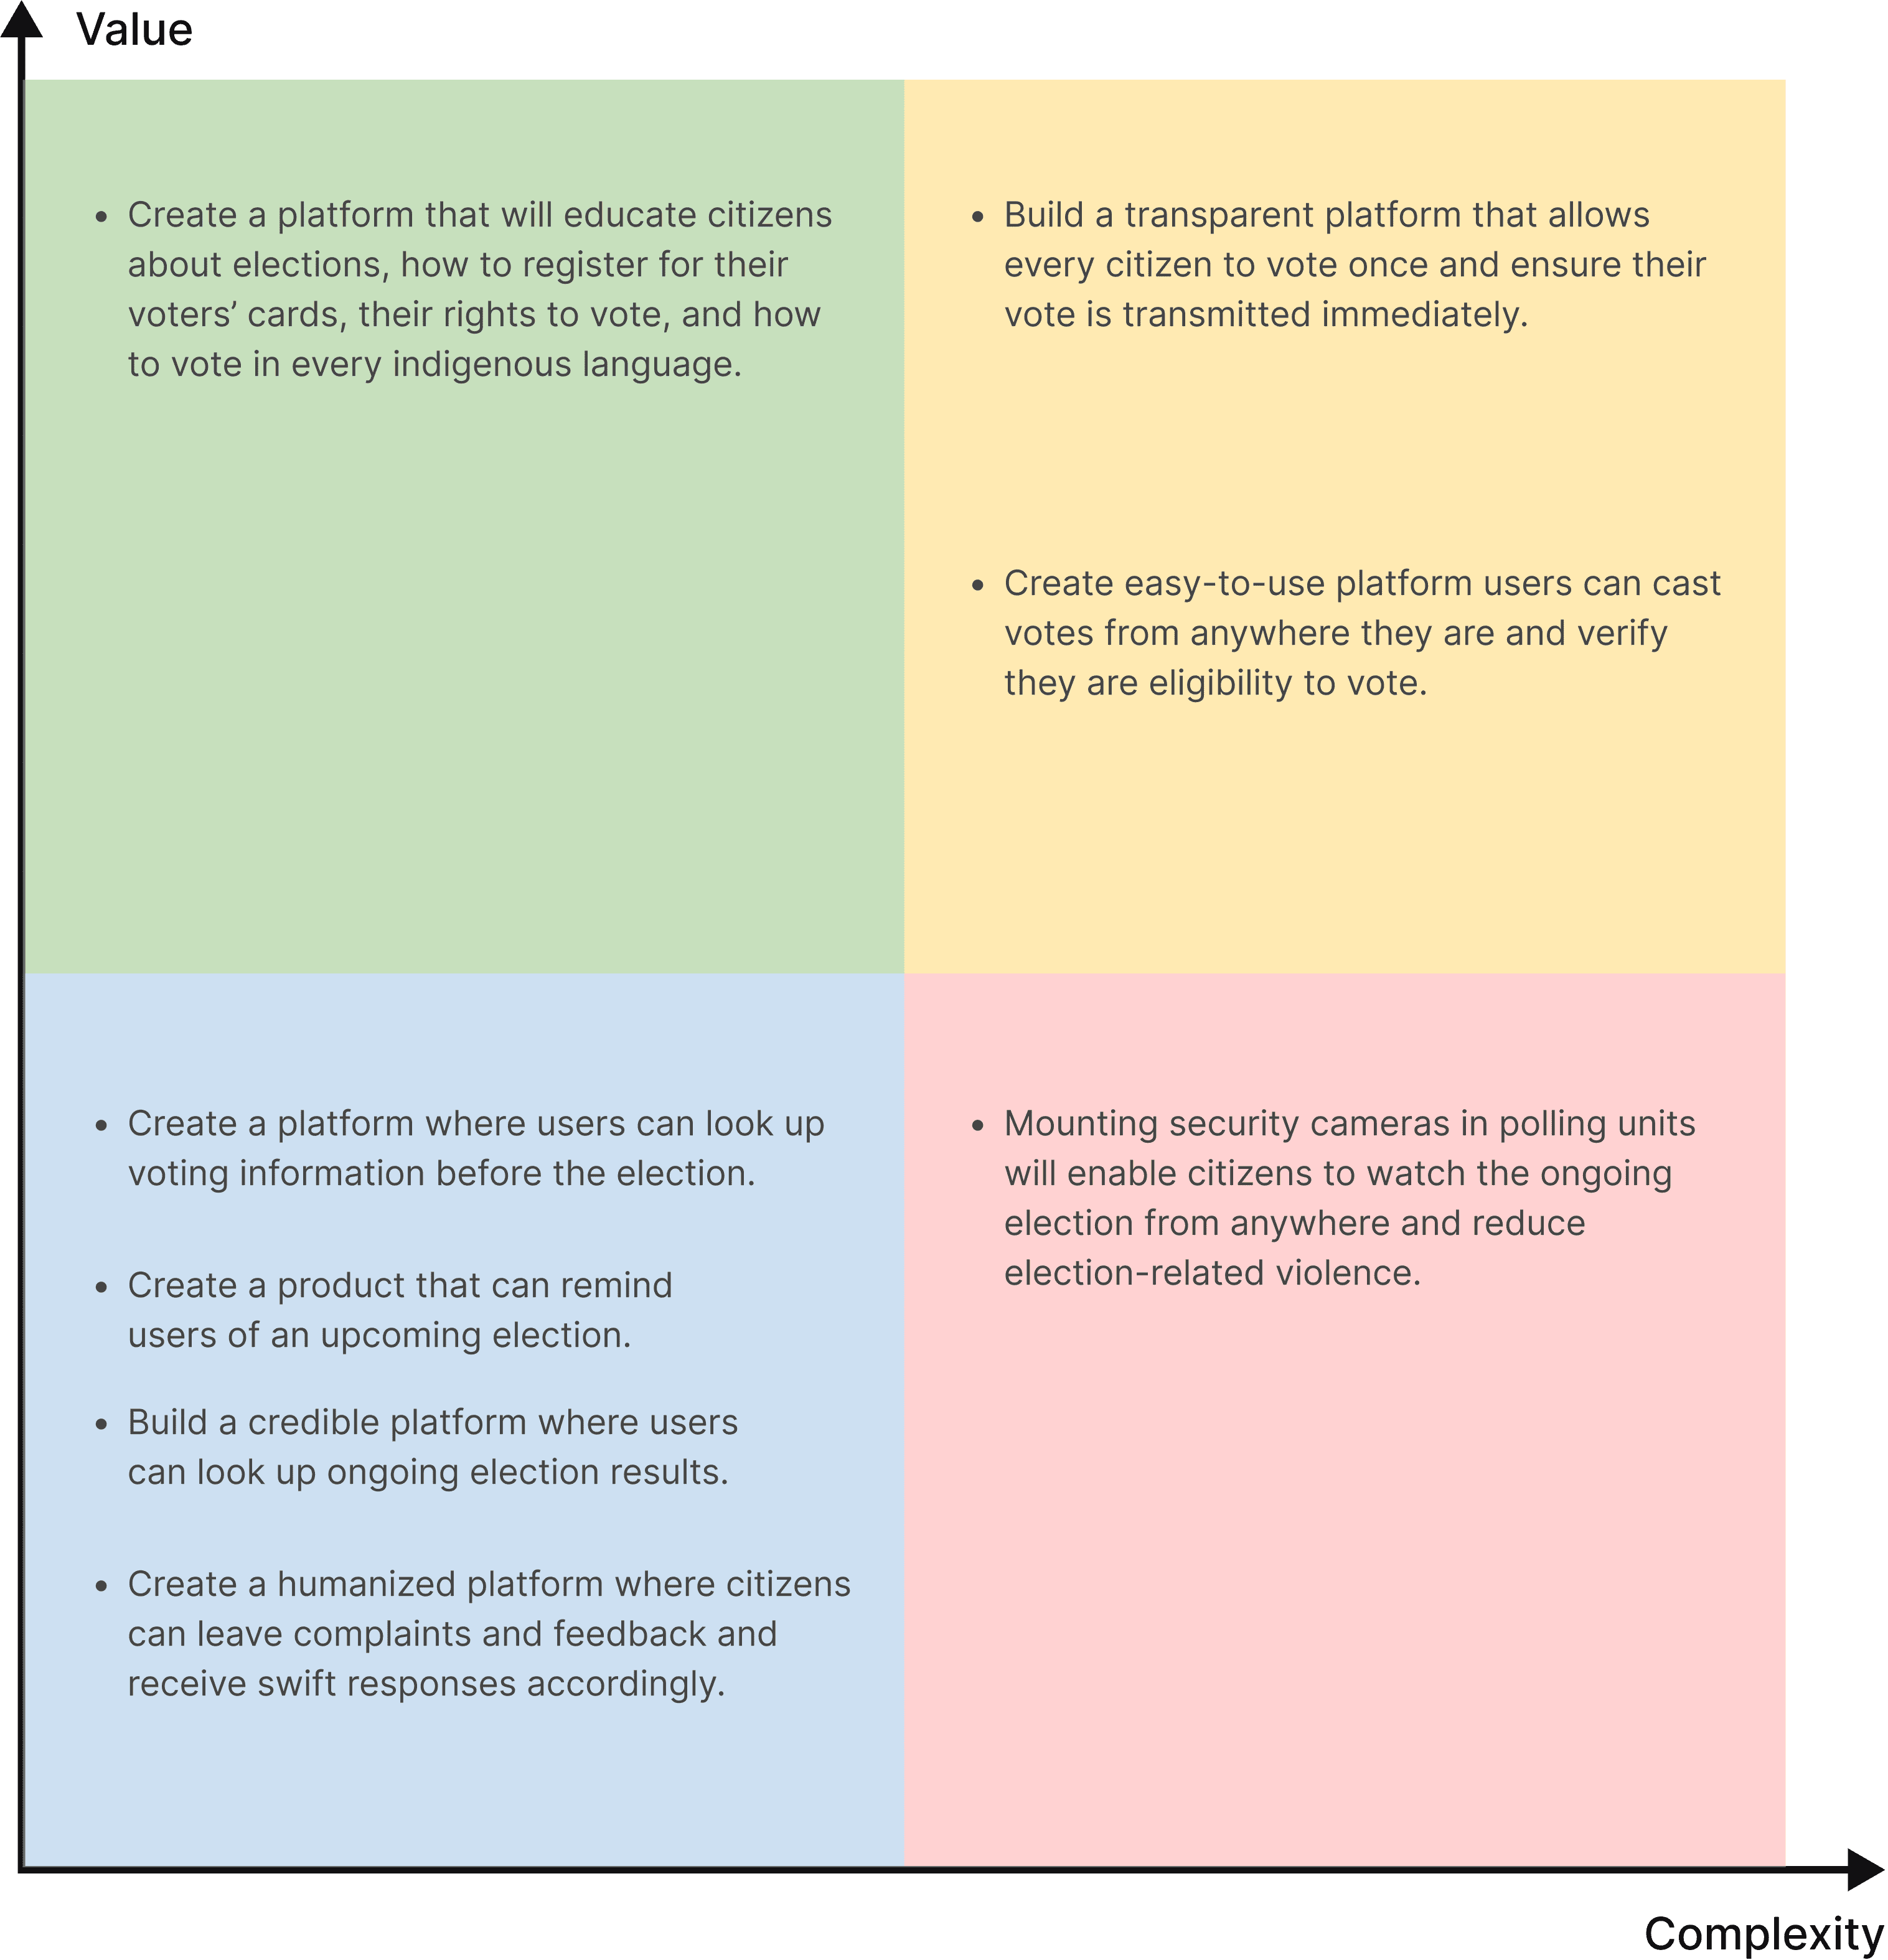
We prioritize and picked out feasible ideas based on value to our users and complexity in implementation using the Value vs Complexity matrix.
I laid out the movement users' will take through our platform, mapping out each step and use cases the user takes from the entry point right through to the final interaction after a defined functionality of the platform by the team.
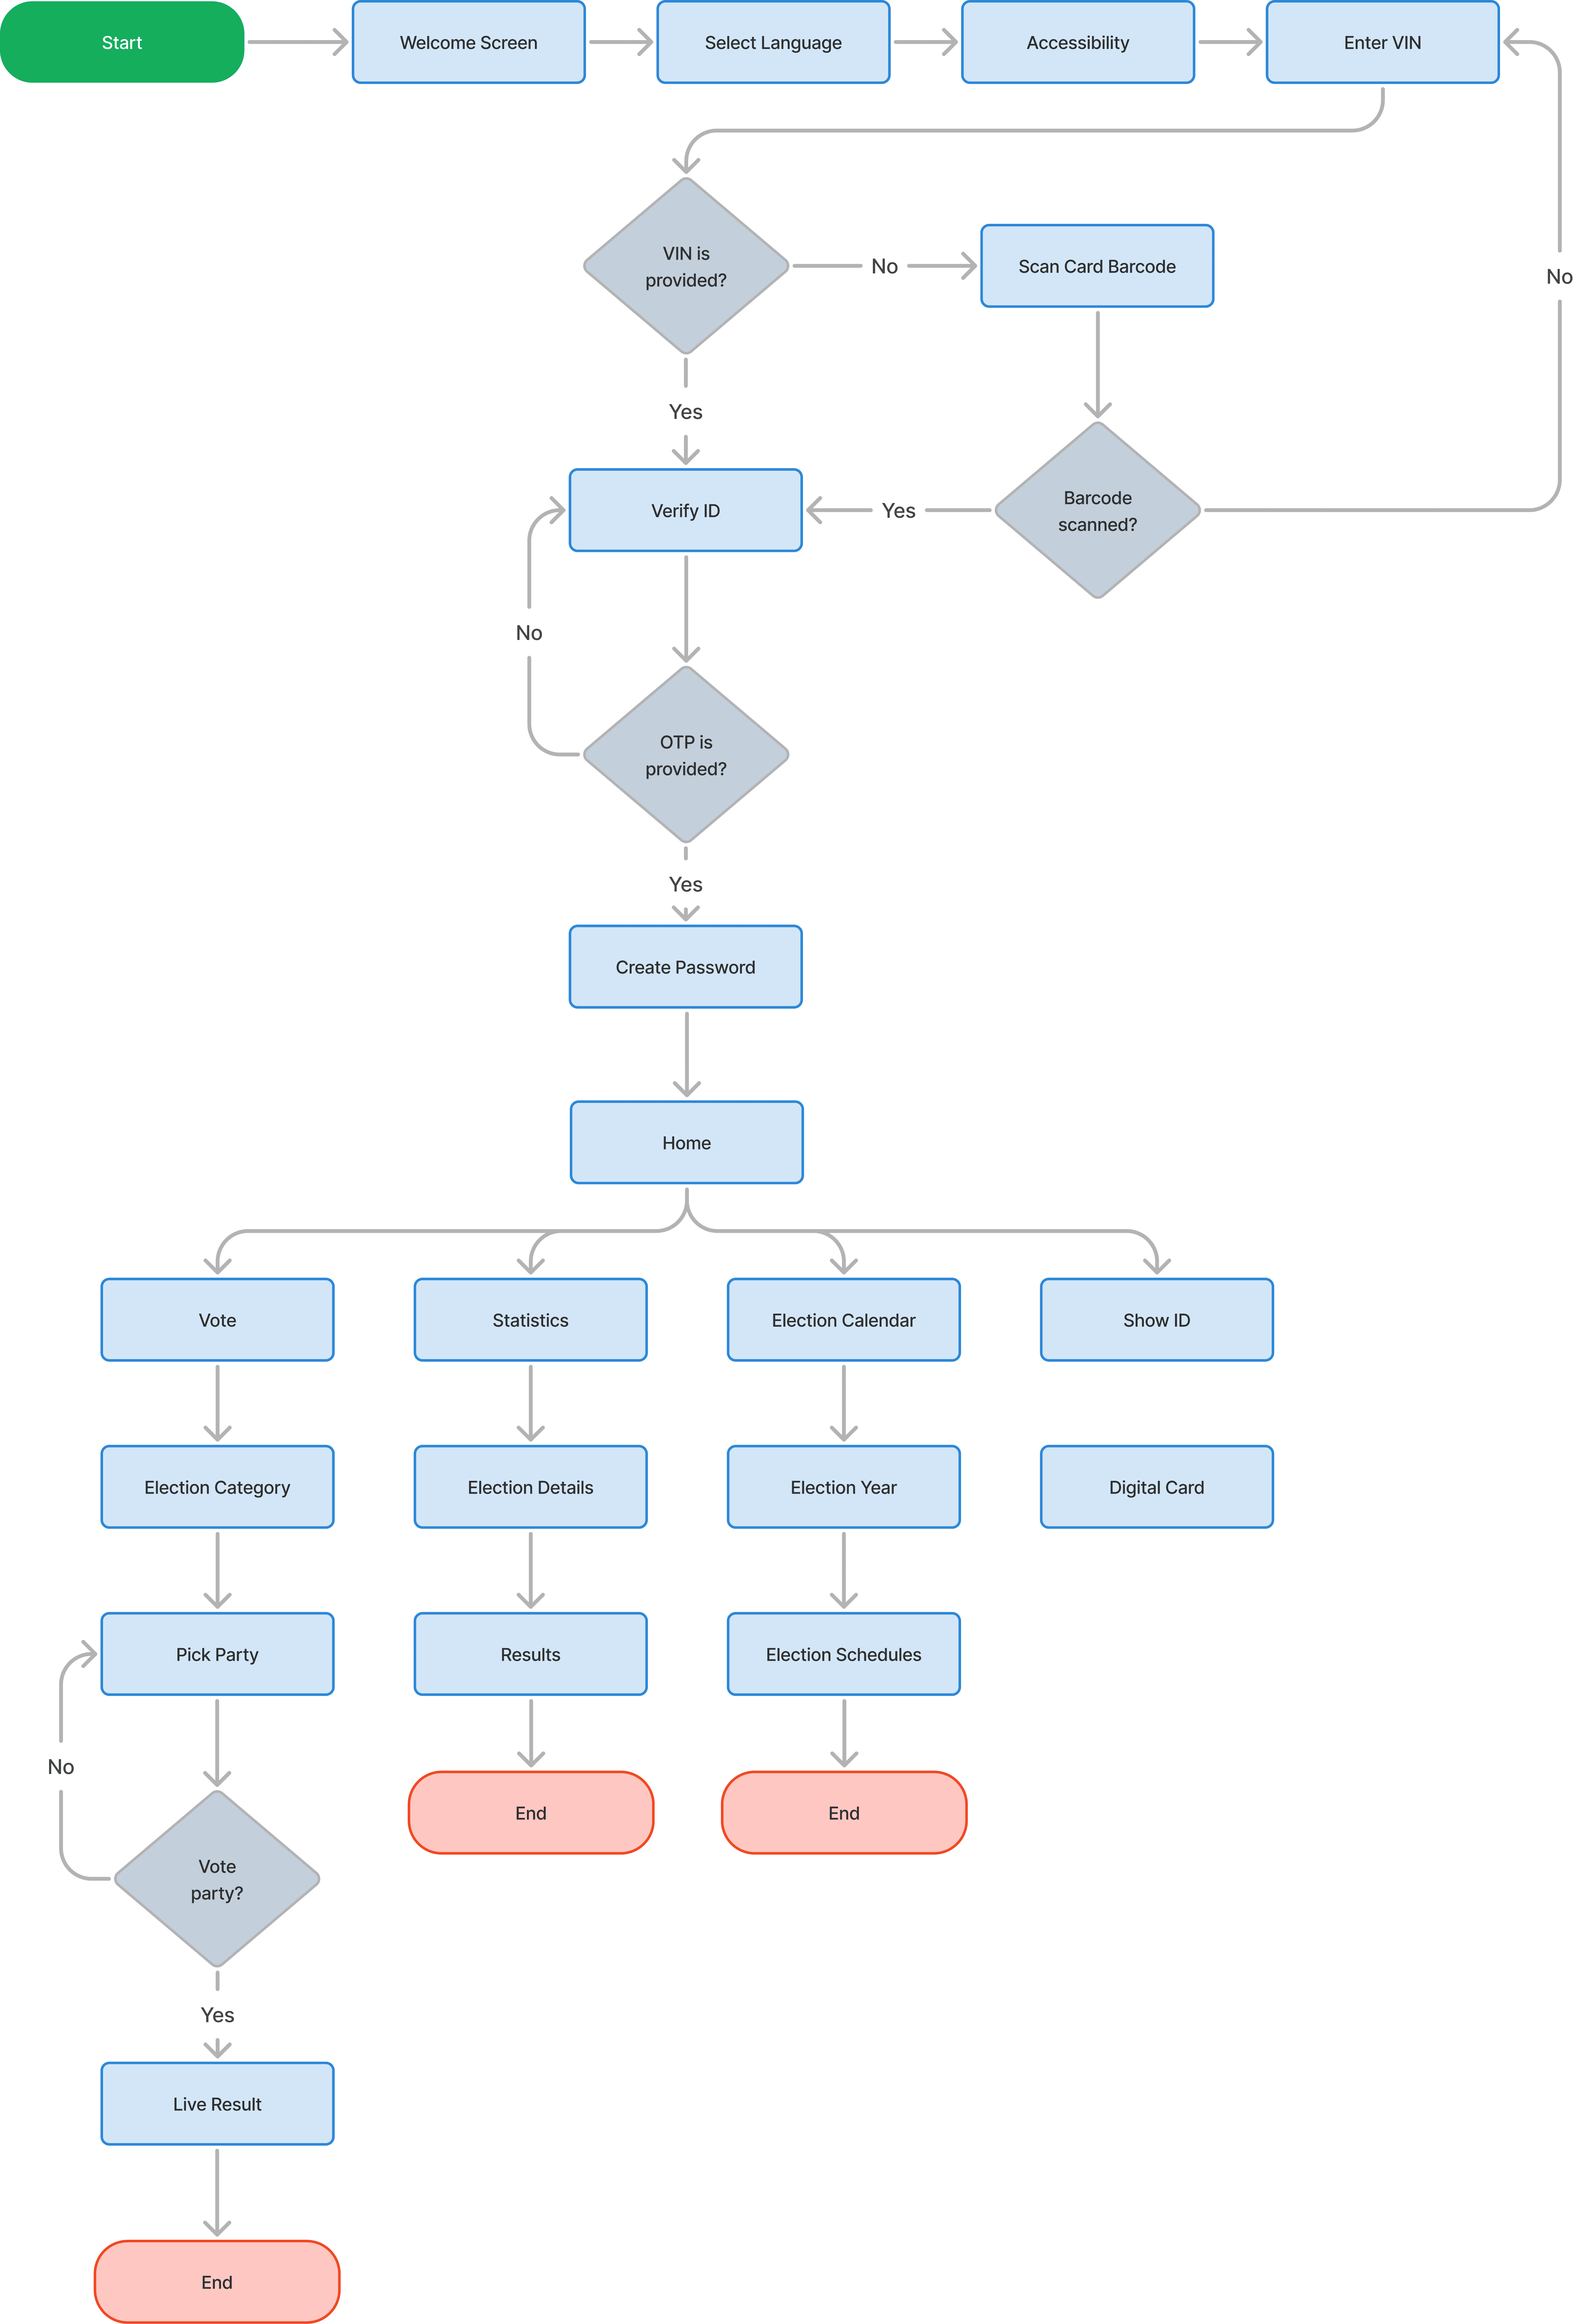
Voting user flow
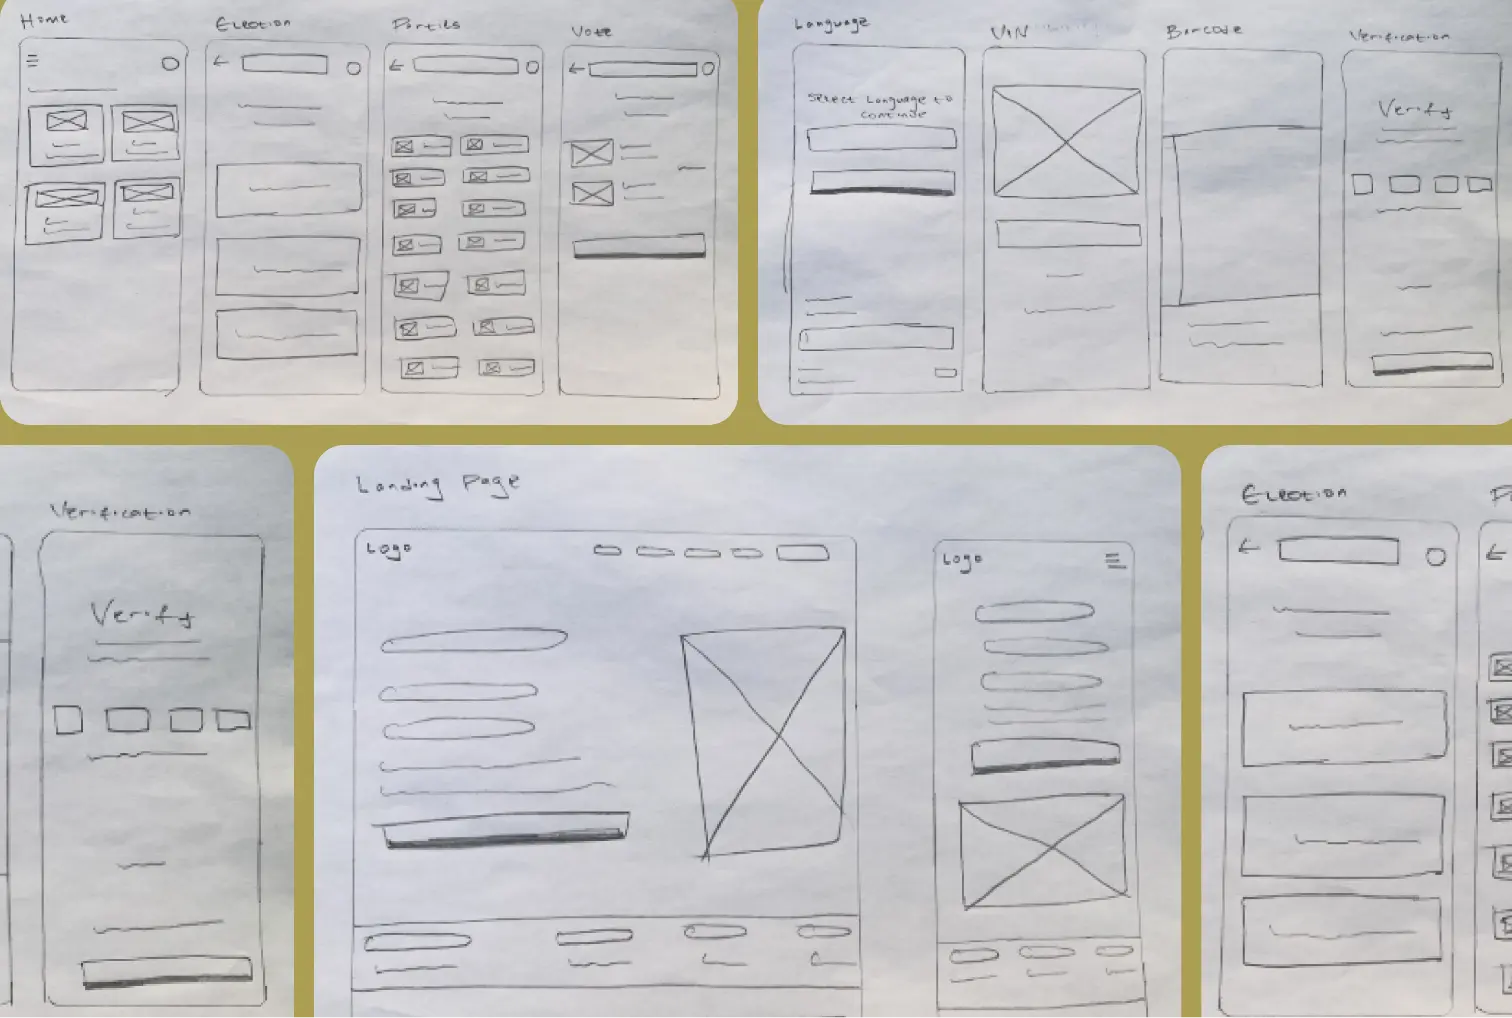
Starting out my visual design process, I write a list of the information that needs to go on a page, and quickly bring out my ideas through sketching which is faster and easier. The goal here for me was to get all my ideas out, so I stayed focused on quantity rather than quality. With the aid of my problem statements, I was able to sketch out my ideas rapidly and settled in for the ones I want to explore further in a digital wireframe.
Mid-fidelity wireframes were created with enough detail so that users can understand the basic features and navigation during usability testing.
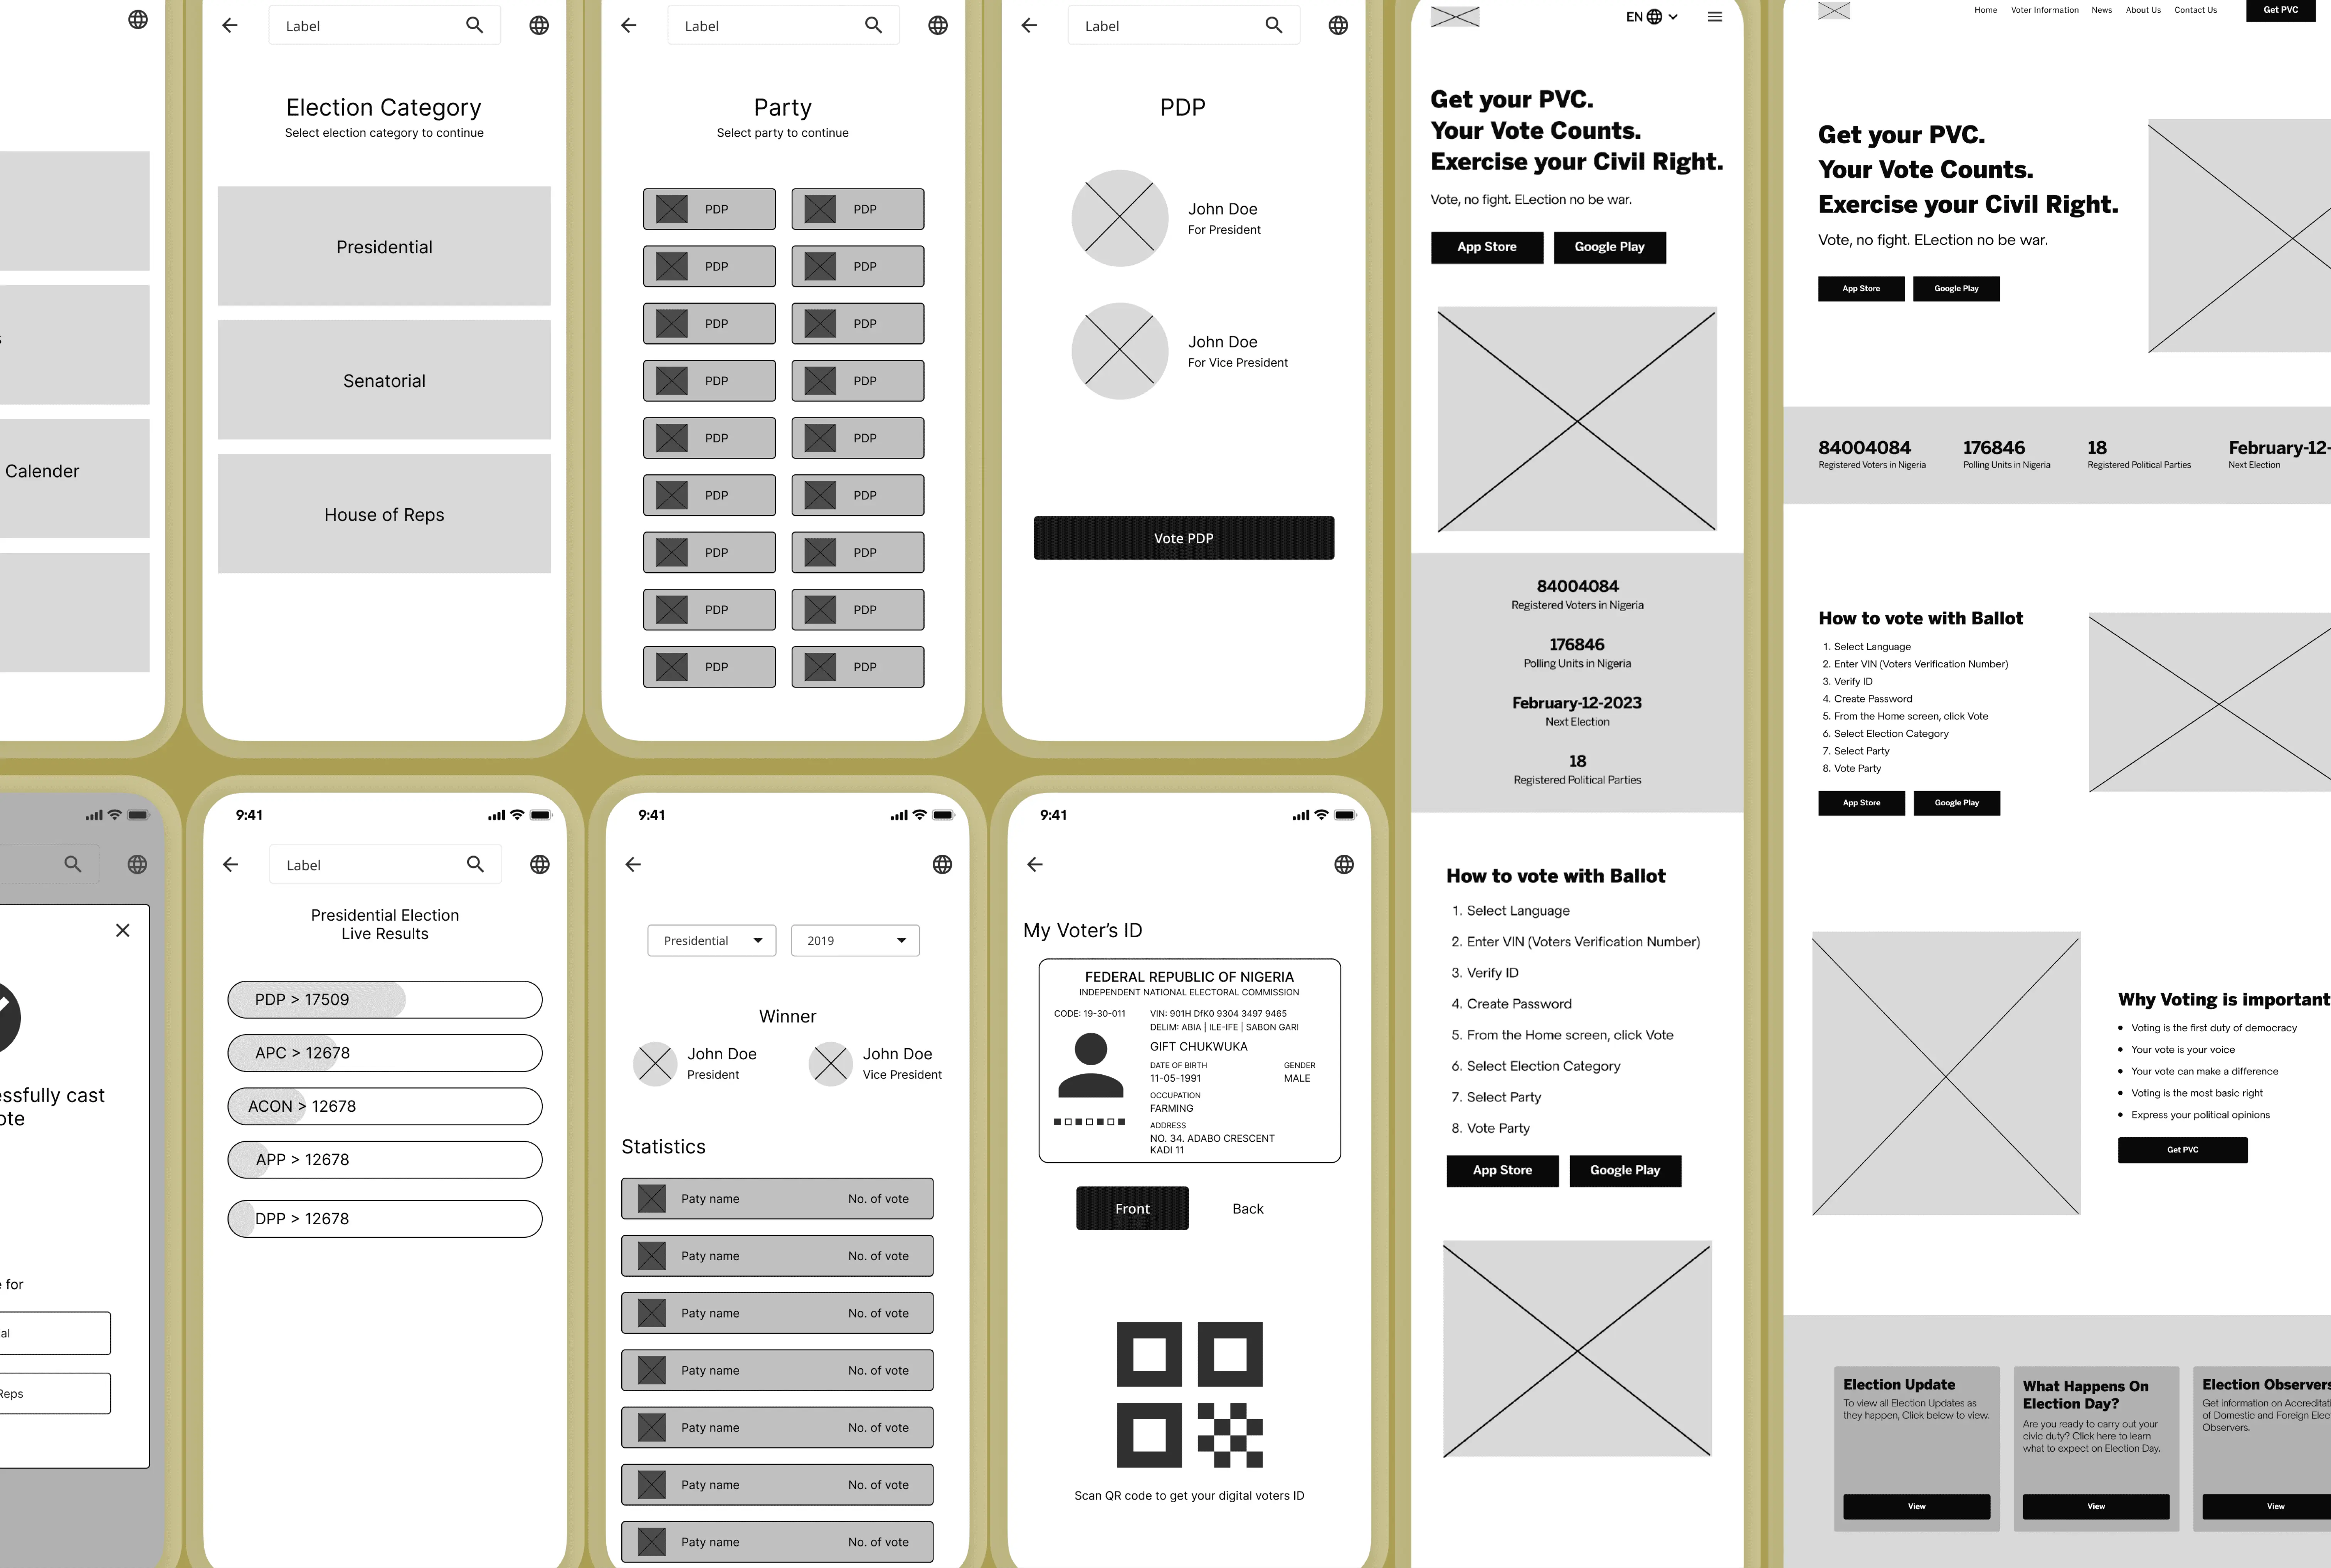
The mid-fidelity wireframes with limited functionality and aesthetics were tested by 12 users (6 Disability users, 3 Adults, and 1 Young adult) through a moderated usability testing. We wanted to test the effectiveness of the layout and navigation, onboarding flow, landing page structure, vote casting flow, election stats flow, and election calendar flow.
After testing our early concepts with real users, I implemented the findings from the usability studies and then came up with more realistic designs that match the final designs in terms of details and functionality. I went on to design high fidelity screens for desktop and mobile.
Considering our first persona that represents users with a disability, we added some features that will make our product inclusive to our users.
Ballot's accessibility screen
The platform is able to create a digital voter’s card by collecting citizens’ VIN. The platform can scan voters’ card barcodes to generate voter information in case the VIN on the card is faded.
Security is a priority in our platform, we aimed for “One man One Vote” so we implemented extra verification steps. An OTP will be sent to the mobile number used during the voters' registration. In cases when the user is no longer using the same phone number, we implemented facial recognition to capture the user’s photo and match it with the one on the voter’s card.
Ballot's verification process and Digital Voter’s Card

Ballot’s responsive landing and news page design
Some of the other screens
Casting a vote with Ballot
Designing for a diverse and nationwide audience highlighted just how complex and nuanced inclusive experiences can be. Early in the process, synthesizing research feedback from different demographic groups felt overwhelming, as needs, expectations, and constraints varied widely. Progress became clearer when I shifted the focus toward the least represented and most constrained users and adopted an inclusive design mindset, designing for those at the edges in order to improve the experience for everyone.
Considering people living with disabilities more intentionally became a turning point in the project. By prioritizing accessibility, clarity, and simplicity, the product direction evolved into something that was not only more inclusive, but also easier and more intuitive for all users. This shift reinforced an important lesson for me: inclusive design is not a constraint, but a way to arrive at better and more resilient solutions.
As a next step, this project would benefit from deeper validation around trust, security, and reliability, areas that are critical for any voting-related system. Future iterations would focus on stress-testing the flows, strengthening identity verification concepts, and exploring how the experience could better communicate transparency and confidence to users.